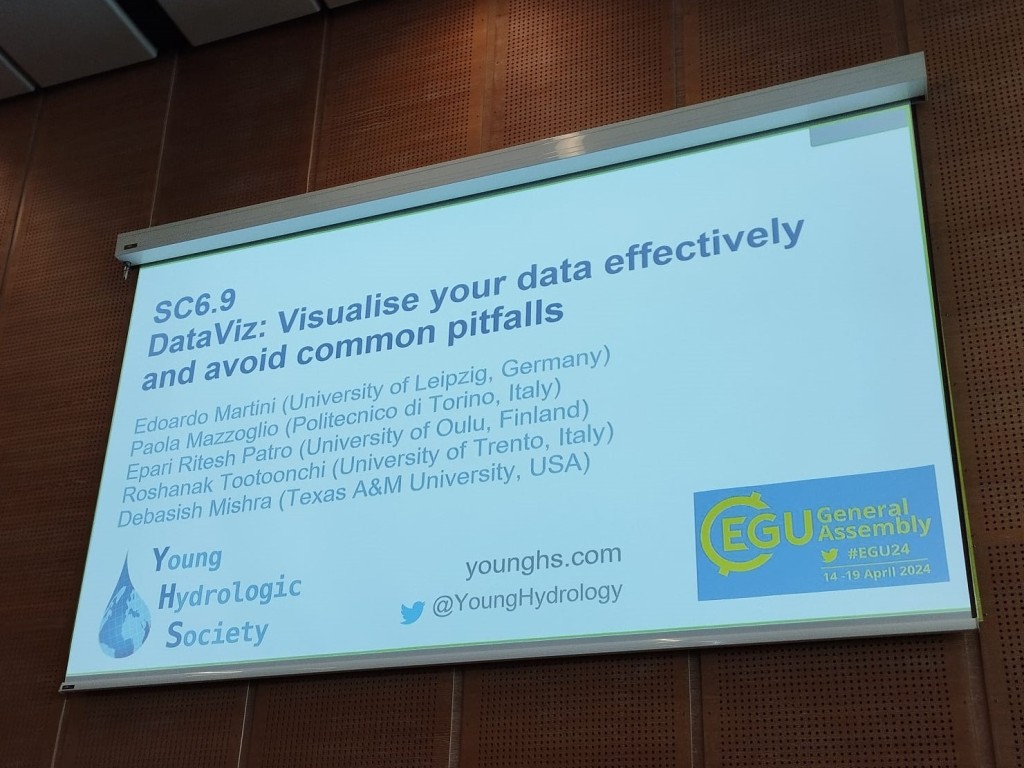
During the conference EGU General Assembly 2024 held in Vienna a few days ago, the Short Course “DataViz: Visualise your data effectively and avoid common pitfalls” was delivered. This course was co-organized by the Young Hydrologic Society (YHS) and was designed to help scientists (early career scientists in particular) improve their data visualization skills in a way that the research outputs would be more accessible, less biased and more understandable within the scientific community.
Topics discussed include:
- Fundamentals of DataViz
- Choosing a plot type
- Color schemes
- Publication compliance
- DataViz with R
- DataViz with NCL
During the sessions we had some interesting discussions about data visualization, and, unfortunately, we ran out of time. This implied that we were not able to present all the materials that we prepared.


We decided to upload all the materials that we prepared, to allow people interested in this topic to have a look at it.
The course materials (slides + video tutorials) are available below.
Here you can find the slides!
Here you can find two interesting tutorials prepared by Debasish and Roshanak!
Video DataViz with R: https://drive.google.com/file/d/10ZQ5l8f_JzzUk6hUCU60LgtyZMCbAq1B/view?usp=sharing
Video DataViz with NCL: https://drive.google.com/file/d/1ktjxWxq4TuL9mTpcjPkm6hHuTezvMxI9/view?usp=sharing
The presenters can be contacted via e-mail for any questions and follow-ups.
- Edoardo Martini, edoardo.martini@uni-leipzig.de
- Paola Mazzoglio, paola.mazzoglio@polito.it
- Epari Ritesh Patro, erpatro@gmail.com
- Roshanak Tootoonchi, roshanak.tootoonchi@unitn.it
- Debasish Mishra, debmishra@tamu.edu

